Marketing Logic has supplemented GIS Atlas with a presentation module which includes geo-solutions
28 April, 2021
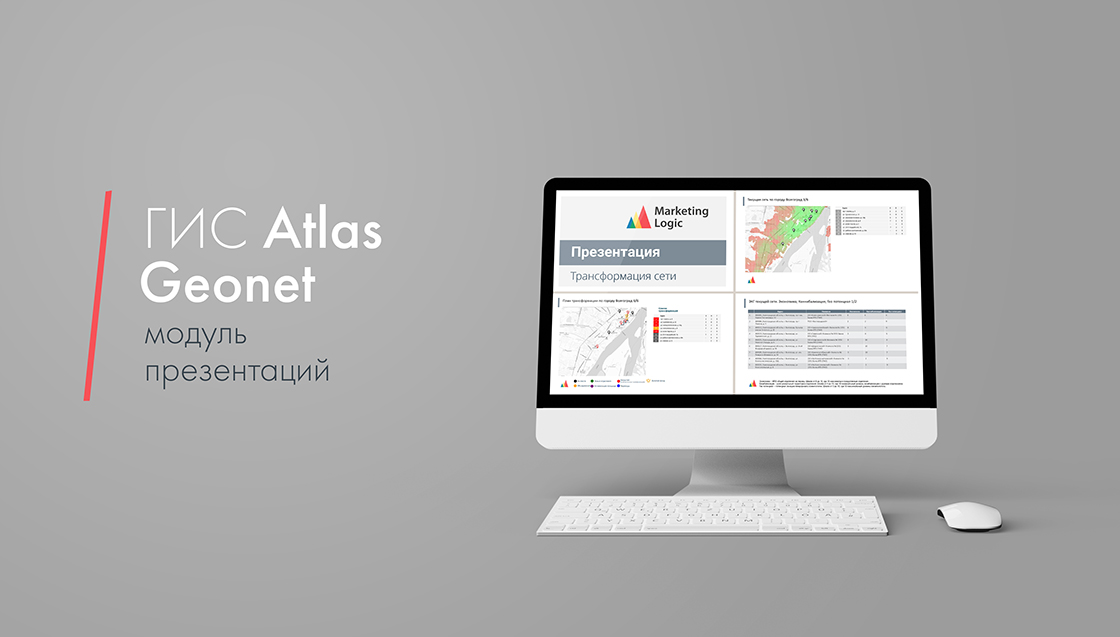
Geo-information system Atlas has expanded its functionality. Now users have access to the module for generating and uploading presentations with ready-made solutions, infographics and calculations.
The system generates presentations based on the type of project being implemented and the scope of tasks. For example, as part of a project to transform the network on a national scale, GIS Atlas generates a presentation report with a transformation roadmap, targets for each city, and illustrative screenshots from the map interface with the necessary calculations and labels. In the form of a map and a compressed diagram, the module shows the geolocation of "bad" and "good" locations, a description of the necessary actions in the format: "Point #1-necessary actions: transfer to geolocation # 3". The diagram and map are accompanied by compressed calculation data and estimated indicators, taking into account the implementation of the solution.
«We implemented this solution mainly in order to save time on preparing presentations for the top management of our clients. Before that, marketing specialists and our employees "translated" solutions from the language of geoanalytics to the language of generalized reporting. The management wants to see the main thing: what is being transformed, where is being moved, and what will be the indicators when implementing a particular scenario, for example, it can be a ready-made presentation with financial indicators and specific actions for branches. All this is now done by the Atlas GIS and the Geonet service in automatic mode and in a minimalistic design – only the basic data and the logo. If the project is large-scale, then we customize the appearance taking into account the wishes of the client», says Dmitry Galkin, Managing Partner of Marketing Logic.
Marketing Logic is ready to present a sample of a ready-made presentation on the example of a certain city of the project implementation. Requests are accepted by email or via the feedback form.